

Description
Take full control of your finances with this professional Excel Finance Dashboard — built for individuals, small business owners, and finance teams who want clarity without complexity.
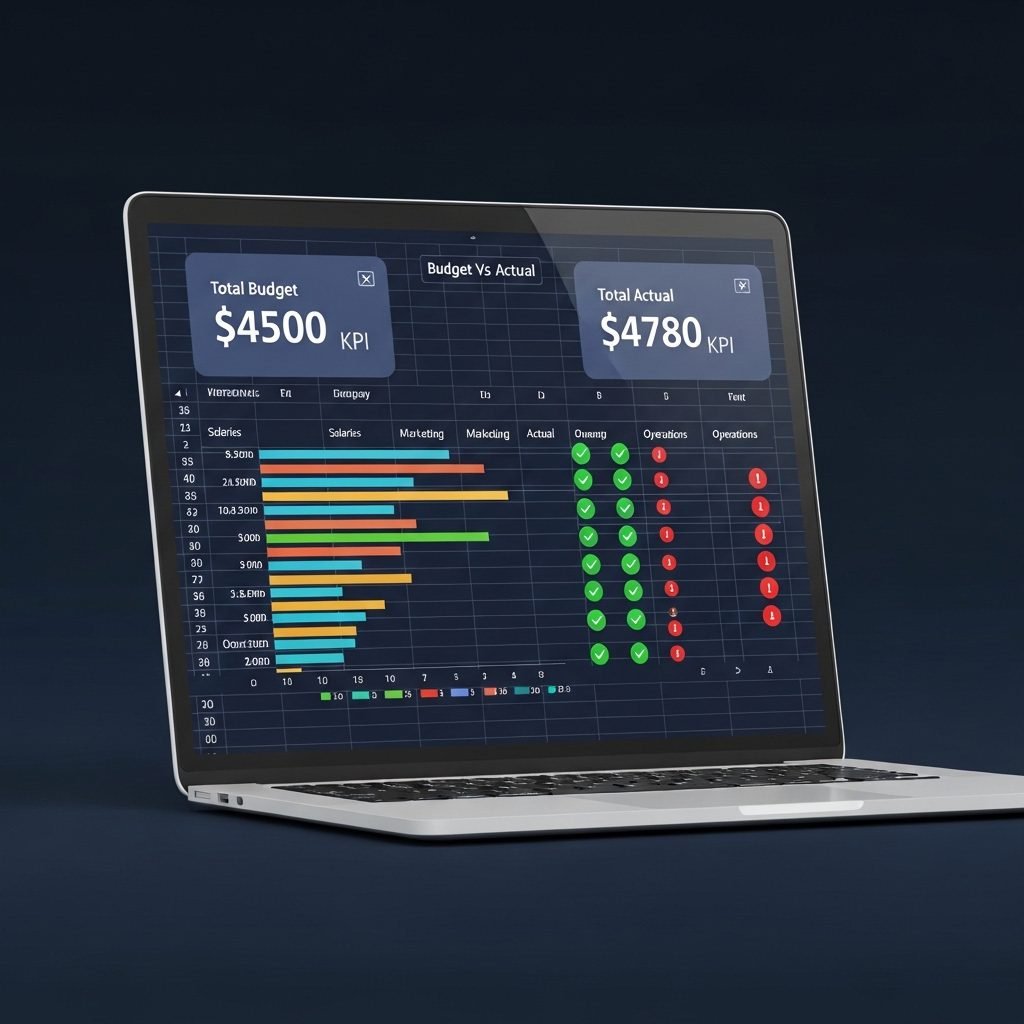
This ready-to-use spreadsheet gives you a complete Budget vs Actual analysis across 8 spending categories and all 12 months of the year. Color-coded status indicators flag overspending the moment it happens, while dynamic variance calculations update automatically as you enter your numbers.
What’s included:
- 📊 Executive Dashboard with KPI cards (Total Budget, Total Actual, Variance $, Variance %)
- 📋 Monthly Summary with 12-month category breakdowns
- 🔍 Category Analysis with visual spend bars and month-by-month drill-downs
- 📈 Monthly Trend Report to track patterns over time
- 📖 Step-by-step How To Use guide built right in
No formulas to build. No pivot tables to configure. Just open, enter your numbers in the Raw Data sheet, and every chart and report updates automatically.
Works in Microsoft Excel 2016+ and Google Sheets (with minor adjustments). Instant download. Completely free.

Reviews
There are no reviews yet.